[ad_1]
Continuous integration is an essential part of the software development lifecycle, and performance monitoring is a key part of continuous integration. We will learn how to set up performance monitoring with the popular Jenkins automation server, and Apache JMeter load and performance tester.
Continuous integration (CI) systems orchestrate and automate software build, testing, and deployment processes. CI systems:
- Monitor source code repositories.
- Run builds whenever code changes are detected.
- Run tests against compiled software (unit, acceptance, automated, performance, integration).
- Generate artifacts (binaries, documentation, installation packages).
With these benefits, it’s no wonder that CI systems are widely adopted by software development companies as vital parts of the modern software development life cycle.
By implementing CI into your workflow, you have already checked off the first three items ofJoel Spolsky’s 12 Steps to Better Code. If you are not familiar with Joel Spolsky, he is a prominent developer and co-founder of Stack Overflow, and he has set the standard in modern software development workflows. His checklist includes:
- Do you use source control?
- Can you make a build in one step?
- Do you make daily builds?
Why performance testing is important in the CI process
Adding performance tests to your CI scope reduces the risk of performance degradations whenever a new feature is added, or a bug in the product is fixed.
For example, if the latest commit inadvertently causes response times to go above an acceptable threshold or service-level agreement (SLA), your CI system will automatically raise a red flag and mark the build as failed. This makes it easy to identify what caused this problem.
It is better to run performance tests in the early software development stages. If a major error is detected in the pre-release phase, it will be harder to identify and fix the issue.
JMeter and Jenkins are the leading tools for performance testing and CI. They are both open source, have great documentation, and large, active communities.
How to install the Jenkins and JMeter plugin
If you don’t already have Jenkins installed, follow these steps to get up and running quickly.
- Download the latest Jenkins release (the .war file should be enough).
- Run Jenkins as java -jar jenkins.war and wait for the “Jenkins is fully up and running” message.
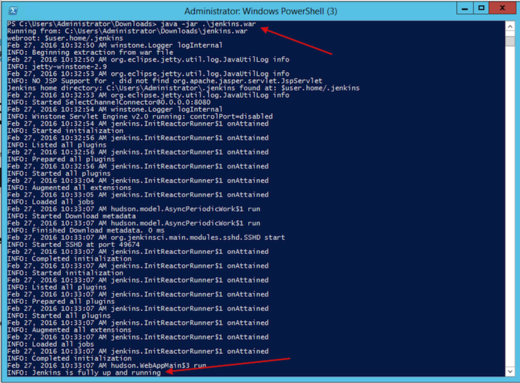
- Open http://localhost:8080 in your web browser.
- You should now be able to see the Jenkins dashboard.
To get JMeter support on Jenkins, you need to use the Performance Plugin. Here is how:
- Download the latest version of the plugin.
- Copy the performance.hpi file to the plugins folder of your Jenkins installation. If you run Jenkins from the .war file, copy the plugin to the .jenkins/plugins path under your home folder.
- Restart Jenkins to detect and load the plugin.
- If the installation is correct you should see the Publish Performance Test Result Report option under Jenkins -> Your Project -> Configure -> Add post-build action dropdown.
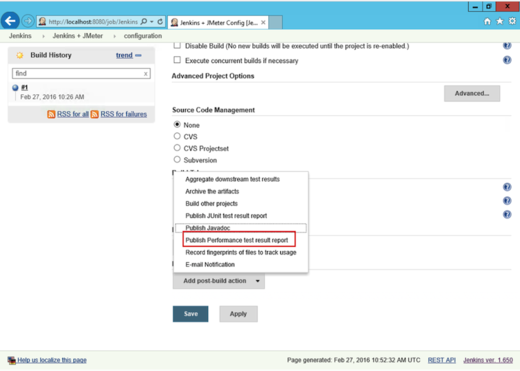
How to run a JMeter test in Jenkins
Running a JMeter test in Jenkins isn’t very complex. Just remember that the test has to be run in from the command line. For your first couple of runs, you should configure JMeter to store its results in an XML format:
- Add the jmeter.save.saveservice.output_format=xml line to the user.properties file in the /bin folder of your JMeter installation.
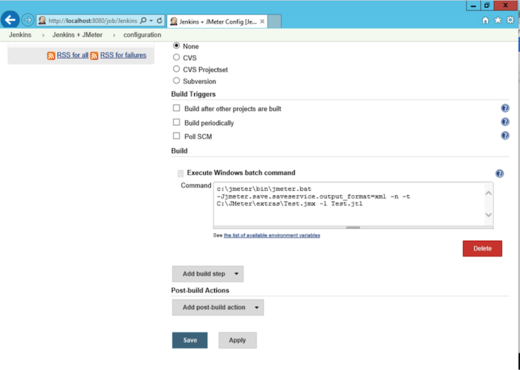
- Pass the property via the -J command-line argument, such as: C:jmeterbinjmeter.bat -Jjmeter.save.saveservice.output_format=xml -n -t C:jmeterextrasTest.jmx -l Test.jtl
Here is how it looks when the Windows batch is configured to command to run a JMeter test:
To verify the execution was successful, or to get extra information regarding any problems, check the Console Output tab of the project.
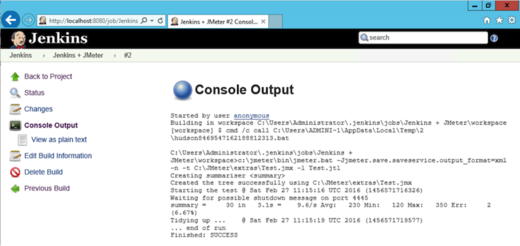
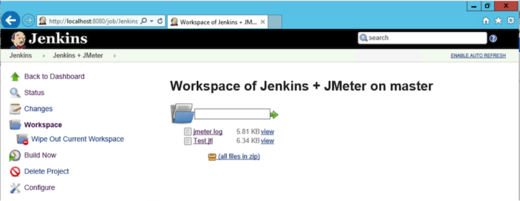
You can find the JMeter log file and the .jtl results file under your project’s Workspace.
How to use the Performance Plugin
The Performance Plugin displays statistics, trends and can be used to mark builds as failed based on results. Follow these steps to add it to your project:
- Open the Jenkins project.
- Click the Configure button.
- Click the Add post-build action button.
- Select JMeter to output results in XML format.
Now you have automated your performance testing, and can spend more time on improving your software instead of struggling with identifying performance problems.
[ad_2]
Source link