[ad_1]
Dr. Geo II is an open source application that allows users to explore geometry first-hand. Its target audience is school-age children. As school is now in session for many kids, here’s a brief tutorial on how to get started with Dr. Geo II.
First, Dr. Geo II is available for download as a ZIP file. Simply extract the file and run Dr. Geo II from its folder without need of installation. Dr. Geo II is available for Linux, Microsoft Windows and Mac OSX. Also, check out the Dr. Geo user guide and video tutorial.

Get started with Dr. Geo
Upon opening Dr. Geo II, users can see that the interface is straightforward with a menu across the top of the screen, a toolbar below that, and a row of tabs beneath the toolbar.
The available menu options are File, Edit, Points, Lines, Transformations, Numerics & Text, Scripts, Macro Construction, and Animate. These menu options are also offered on the tabs below the toolbar. The toolbar offers the following items: Open a blank sketch, Open a sketch, Keep a sketch permanently, Undo, Redo, Show/hide grid, Snap to grid, Toggle object selection, Select and move an object, Erase, Edit object style and Edit an item‘s property. Below this, each tab offers options found under the menu headings. Below these are two panes, a narrow one on the left and a wider one on the right. The right pane serves as a virtual sketchpad for drawing geometric figures. The left panel is where coordinate information regarding points is recorded. At the bottom of the screen are tabs, each of which represents an open Dr. Geo window, when multiple windows are open.
Creating geometric figures is easy and can be done in several ways. You could select Point from the Points menu and click on the sketchpad to place points at desired locations. These could in turn be connected using the Line option under the Lines menu. There is, however, an easier way.
Under the Lines menu, or under the Lines tab, you will find several options for creating figures. Let’s start with a line. Choose Line from under the Lines menu and click anywhere on the sketchpad. A line will appear on the sketchpad. You’ll notice a few things. First, the line stretches to either end of the sketchpad. It is a line and runs on infinitely in both directions. Next, notice that there is a point on the line. Moving the mouse causes the line to rotate around this point. Select Point from the Points menu. Clicking on the line places another point upon it, around which the line can also be rotated. Lastly, note the pop-up message that identifies each component as “This line” or “This point.” This helps to ensure that formatting and repositioning are applied to the right figure.

You will further notice that if you click on the line, you can drag it to a desired position as opposed to the rotation that occurs when you click on a point and move the mouse. Looking at the pane to the left, you’ll notice that both points with their coordinates and the line are listed. If you click on the Points menu and choose Point, points can be placed anywhere along the line. Using the Erase tool (third from right on the toolbar) allows you to erase the line and points. Clicking on the Line menu option shows that in addition to lines, users can add rays, vectors, line segments and a variety of shapes.
Now that we’ve explored around a little, let’s get creative.
Go to File and click on New. This gives you a blank sketchpad. Under the Edit menu, check off the items Grid and Axes. This puts a grid on the sketchpad as well the X and Y axes that we find in coordinate geometry. We’ll use these to create a picture. First of all, you can zoom in and out using the mouse wheel and the coordinates adjust to the level of zoom. Zoom in until the coordinates appear in values of whole numbers (1, 2, 3, etc.) as shown in Screenshot 2.

Click on the Lines menu and choose Polygon. We’re going to construct a four-sided polygon at the following coordinates: -7.0:4.0, -7.0:0.0. -1.0:0.0, -1.0:4.0. Simply select Polygon from the Lines menu. Click on the first coordinate then move the mouse pointer to the second coordinate, clicking to put a point on it. Continue on to the third and fourth coordinates. When finished, click on the first coordinate to complete the polygon. The completed polygon will fill with a light blue color.
Now let’s move our polygon.
Choose Select and move an object from the toolbar (fourth from right). Click on the polygon and drag it to these coordinates: -7.0:0.0, -7.0:-4.0, -1.0:-4.0, -1.0, 0.0. It doesn’t have to be 100% accurate. Just do your best. After moving the shape, you’ll notice that the point coordinates in the left pane will automatically adjust to the new positions. Now we’re going to add to our polygon to make it a little more interesting. From the Lines menu, choose Segment. Click on the point at -7.0:0.0. Now release the mouse button and move the mouse pointer to -4.0:2.0 and click the mouse button. You can see that we’ve added a line segment to our geometric figure. You can also see that the point and line segment that we’ve added appears in the left-hand pane. Using the method we just employed, add a line segment from the point at -4.0:2.0 to the point at -2.0:0.0. We now have the makings of a house!

Let’s customize it a bit.
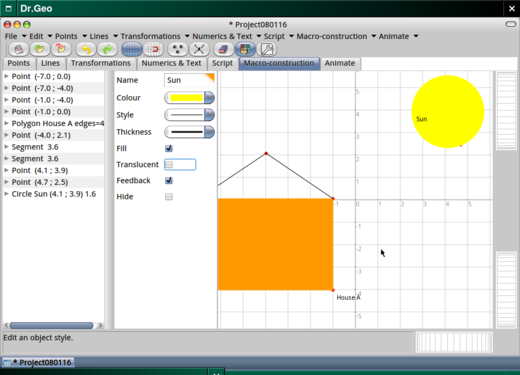
Click on the Edit an object style button (second from right) on the toolbar. Now click on our four-sided polygon (identified as “This quadrilateral”). This opens the Edit an object style pane. You can see that we can customize the following: Name (name the object, note: I named mine “House A”), Colour (object color), Style (line style) and Thickness (line thickness) and we can toggle Fill (object fill), Translucent (object translucence), Feedback (toggles feedback and interaction while mouse hovers over object) and Hide (hide the object). Let’s change the color of our quadrilateral. Click on Colour and choose another color for our polygon. Does the color look faded? We’ll fix that right now. Click the checkbox next to Translucent. The color of the quadrilateral now matches our selected color.
Now click on one of our line segments. Notice that the options in the Edit an object style pane have changed. Name, Colour, Style and Thickness are still there, but Arrow (arrow style) and Mark (add mark to the line segment) have been added. Our toggle options have also changed. We now just have Feedback and Hide. Click on a point and you’ll notice that the options change again. The Edit an object style tool is context-sensitive and changes to meet the criteria for the item in question.
Now go to Lines on the menu and choose Circle. Click on the coordinates 4.0:4.0. Now slowly move the mouse away from these coordinates. You’ll notice that you’ve added a circle and that the circle expands as you pull away from its center. Make the circle as big as you’d like, but be aware that this will be the sun shining down on our house. If you don’t like its position, simply click on the line and drag it to where you’d like it. If you’d like to resize it, click on one of the points and move the mouse to do so. When you’re happy with it, click on the sketchpad. Now click on Edit an object style. It’s your sun, so I’ll leave it to you to decorate as you wish. You can see mine in the screenshot. Click on File and select Save. As you do this, notice the variety of saving options (Save to, Save as, Save multiple, etc.). Name your Dr. Geo creation and click Save. You can also share it on a network if so desired. Dr. Geo II creations can also be exported as graphic images in PNG format.

We’ve created our first picture using Dr. Geo. Please experiment by adding components and modifying them. This is a wonderful way to introduce your students to coordinate geometry, as well as a way to incorporate the arts into mathematics. Geometry is just one side of Dr. Geo. The other side is computer programming with Smalltalk, a very approachable programming language. Users can use Smalltalk to animate their creations, among other things.
References
Fernandes, H. (2016). GNU Dr. Geo [computer software]. GNU and MIT General Public Licenses.
[ad_2]
Source link