[ad_1]
In modern days, software systems are continuously becoming more complex. At the same time customer’s expectations regarding, for example, response times and availability are higher than ever before. As you know, services that perform poorly could drive customers to your competitors’ offerings.
Thus, system failures and poor performance usually have a significant negative impact on a company’s reputation and economic success. The discipline of APM (Application Performance Management) comes to the rescue by providing methodologies and tools to ensure a high quality of service. APM tools provide the means to monitor the health of software systems, detect and react on emerging performance anomalies, and allow for the diagnosis of the root causes of performance problems. A set of commercial APM tools (AppDynamics, DynaTrace, NewRelic, etc.) are available that are rich in their scope of functionality and maturity; however, in some cases commercial tools may not be suitable due to license costs, vendor lock-in, or other reasons that can negatively affect companies following an open source strategy.
InspectIT is a mature open source alternative for APM. The tool provides all the core features that are required for managing the performance of a system. In particular, inspectIT allows you to monitor the health of your system, notifies you in case of performance problems, and give you a sophisticated means for problem diagnosis.
InspectIT at a glance
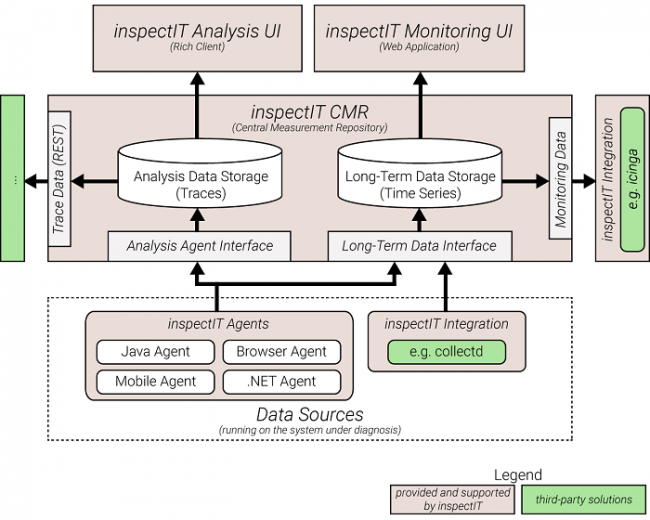
The following illustration shows a high-level overview of the tool.
The architecture behind inspectIT acts as a platform that you can build on and extend, or you can adapt the provided functionality to your requirements and needs. You can divide it into three main types of components: agents, CMR (Central Measurement Repository), and user interfaces.

Agents
The agents are attached to the system, which you should monitor or analyze, and are responsible for collecting data. You can gather statistics of the underlying infrastructure (e.g., CPU utilization, used memory, etc.) as well as detailed run-time data here. For example, in Java applications, these could be execution traces, duration of method calls, JMX beans, or executed SQL statements.
InspectIT provides a comprehensive agent for Java that employs byte-code instrumentation for collecting measurement data.
Aside from the Java agent, developers are creating multiple agents to support further platforms and programming languages; for example, they have made experimental agents for .NET, Android, and Node.js. They are also working on a browser agent that enables the monitoring of the end user’s experience.
CMR
The inspectIT CMR (Central Measurement Repository) is the central component that receives the data gathered by the agents. It manages the data and provides interfaces for queries. Besides data management, the CMR is also responsible for instructing the agents as to which data they should collect.
The CMR differentiates between two types of data: long-term data (CPU utilization, request response times, running threads, etc.) and detailed data (execution traces, method call hierarchies, etc.). The detailed data is stored in an in-memory ring buffer, which the inspectIT rich client can analyze. The long-term data is stored in a time series database, which serves as a basis for web-based dashboards.
User interfaces
Because monitoring the system health and performance problem diagnoses are two different concerns with different target users and different requirements, inspectIT provides two corresponding user interfaces.
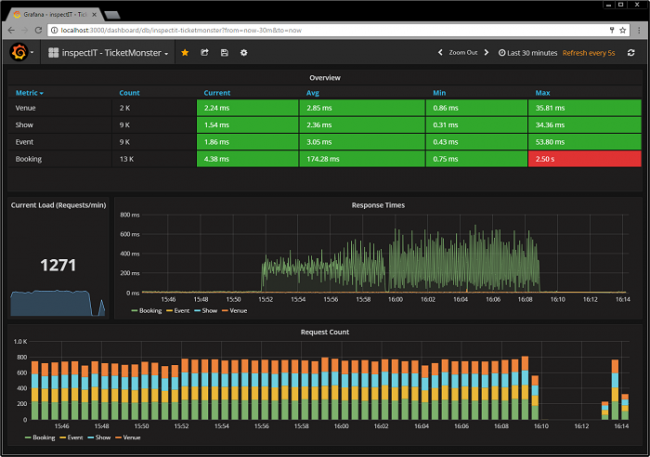
You can use the Web-UI, which is based on Grafana, to see an overview of a system’s current health at a glance. And you can use the rich client for further analysis of the gathered detail data. The following case history explores these user interfaces further.
Case story
If used effectively, inspectIT can improve and ensure the high quality of your system, which positively affects the experience of the end user.
For this purpose, I’ve set up a dummy application and attached the inspectIT agent. The application in use is based on Red Hat’s open source JBoss showcase application, TicketMonster, which represents here an e-commerce web application. In order to present inspectIT’s capabilities, I’ve integrated performance bottlenecks to simulate problems.
Using inspectIT’s customizable web-based dashboard, you can see an overview of the current system status from both a business and a technical perspective. In particular, it can display pure technical metrics like CPU utilization and memory consumption, and it can place the data in relation to a specified business context.
In a typical use case, a system is not manually supervised around the clock, but operators want to be notified immediately when problems occur, such as server failures or performance degradations. For this purpose, you can define alerting rules that trigger actions, such sending an alert email, in case of a rule violation.
One example of this is a rule that sets off an alert when the response time of a request exceeds a defined threshold.

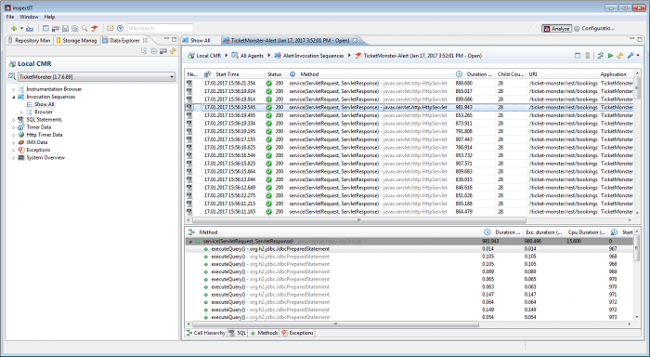
In the next step, you’ll use the inspectIT rich client in order to analyze the gathered data to discover the root cause of a problem. Using an alert ID, which is contained in the received alert email, you can access the dashboard. From it, you can:
- Display all those requests that violated the respective alert rule
- Investigate the execution trace of each request and examine which methods have been invoked and how long the execution took
- Look at the executed SQL statements and exceptions caused by this request
- Request independent statistics (e.g., aggregation of all SQL statements, method timings, etc.) via the data explorer

In the default configuration, only servlet calls and SQL statements are captured and shown in the call hierarchy. Because of this, you can’t exactly see where the time is lost.
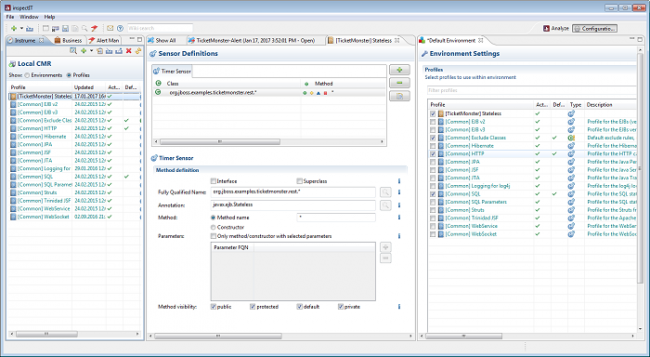
To overcome this problem, add additional instrumentation points to gather more data. To do this:
- Create a new instrumentation profile where you can define the custom classes, which you should then monitor
- You can group these profiles into environments, which will allow you to assign a different set of profiles on different agents

Once the profiles or environments have been saved, the byte-code of the affected classes will be exchanged on-the-fly with byte-code modified by the inspectIT agent. As soon as this happens, run-time data of the newly specified methods will be collected.
If you take a look at a newly captured request now, the data is available in much greater detail. Using this data, you can determine which method is responsible for the long response time. In this example, the root cause of the problem is a method of the previously integrated performance bottleneck.
You can now review the source code and discover why this method is slow. For example, maybe there is a dependency on a third-party service, which is not reachable, or simply a bug in the code.
Final thoughts
Using open source APM software, you can ensure the quality of a system and take steps to improve it even further. You can use this software to react immediately to problems and determine their root cause or at least localize them in a certain level of detail.
Developers are creating many powerful features that will enrich the capabilities of inspectIT significantly.
One of these features is the ability to correlate execution traces over multiple hosts, which increases the system insight, making possible the tracking of the data flow through the entire system. In addition, mobile (Android, iOS) and browser (JavaScript) agents will no longer be in an experimental state—they will be production ready. Using these features, you can see an end-to-end view of the monitored system.
Another feature under development is the autonomous anomaly detection, which enables the usage of smart and adaptive baselines instead of hard thresholds.
This is only a short overview of inspectIT and its capabilities. There are many more features to discover. If you want to try it, you can download inspectIT and its documentation, or you can check out the complete source code from its GitHub repository.
[ad_2]
Source link